Weekly Viz – STD Infection Rates (1996 – 2014)

#MakeoverMonday Week 31 2019

This weeks dataset is from CDC and be found here.

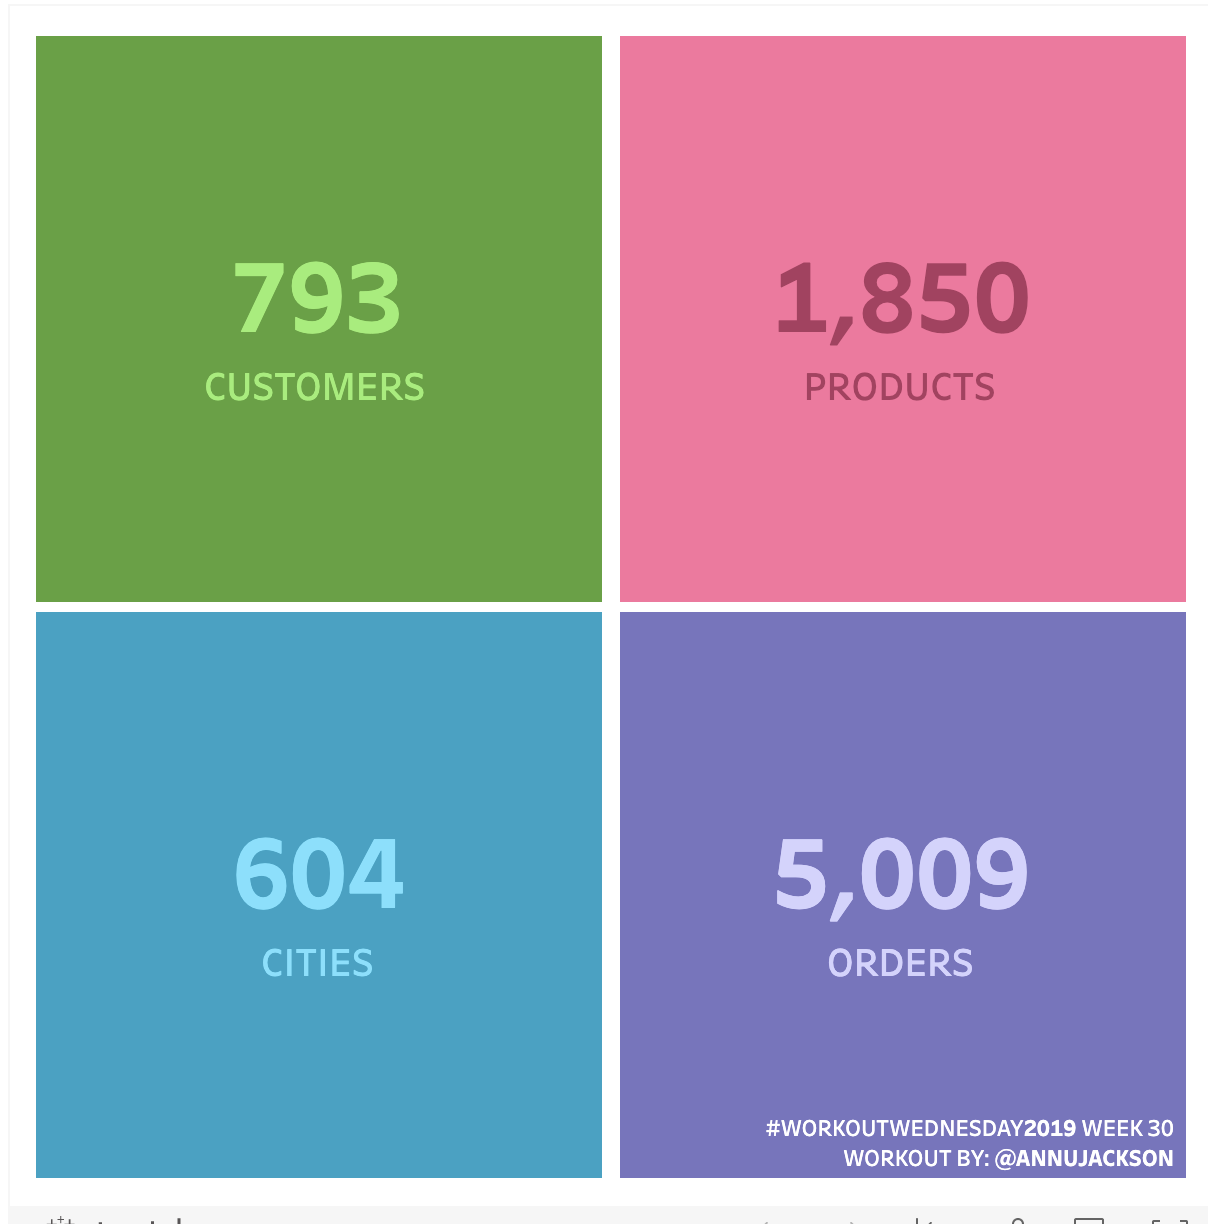
The original visualization is as follows:
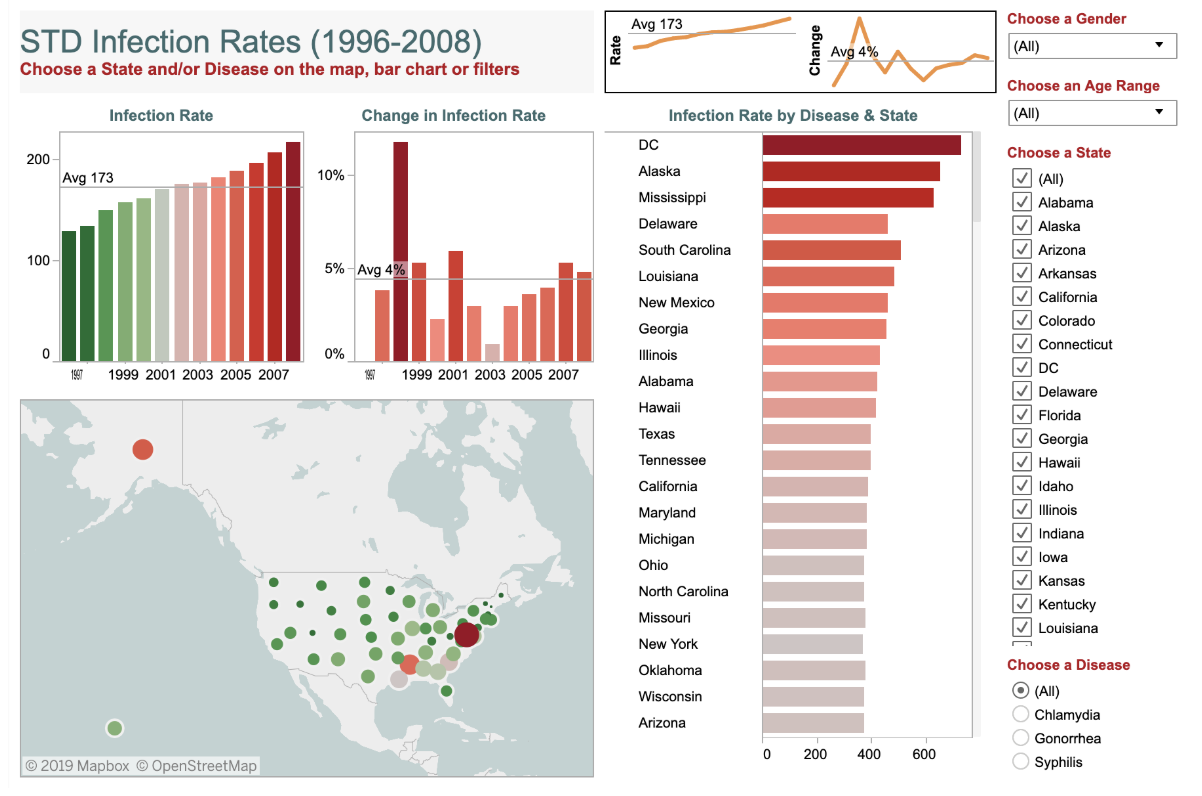
What’s good?

  • Provides an insight into all the information that the dataset packs within
  • Legible labels

What can be improved?

  • I view this as an information overload. Although very insightful – it is too much to process
  • Multiple graphs can be combined into one

I happened to stumble upon multiple articles that outlined data visualization best practices. I realized that although exhaustive – many of the visualizations i had been creating violated many important points highlighted in these best practices.

As someone who creates visualizations, we often become well versed with the dataset; this often translates into non intuitive representations for the end users.

So, for this weeks visualization I embarked on the path of data minimalism – trying to convey as much as possible with as little as possible. Here’s the rendition I made –

Click on the image to view the interactive viz

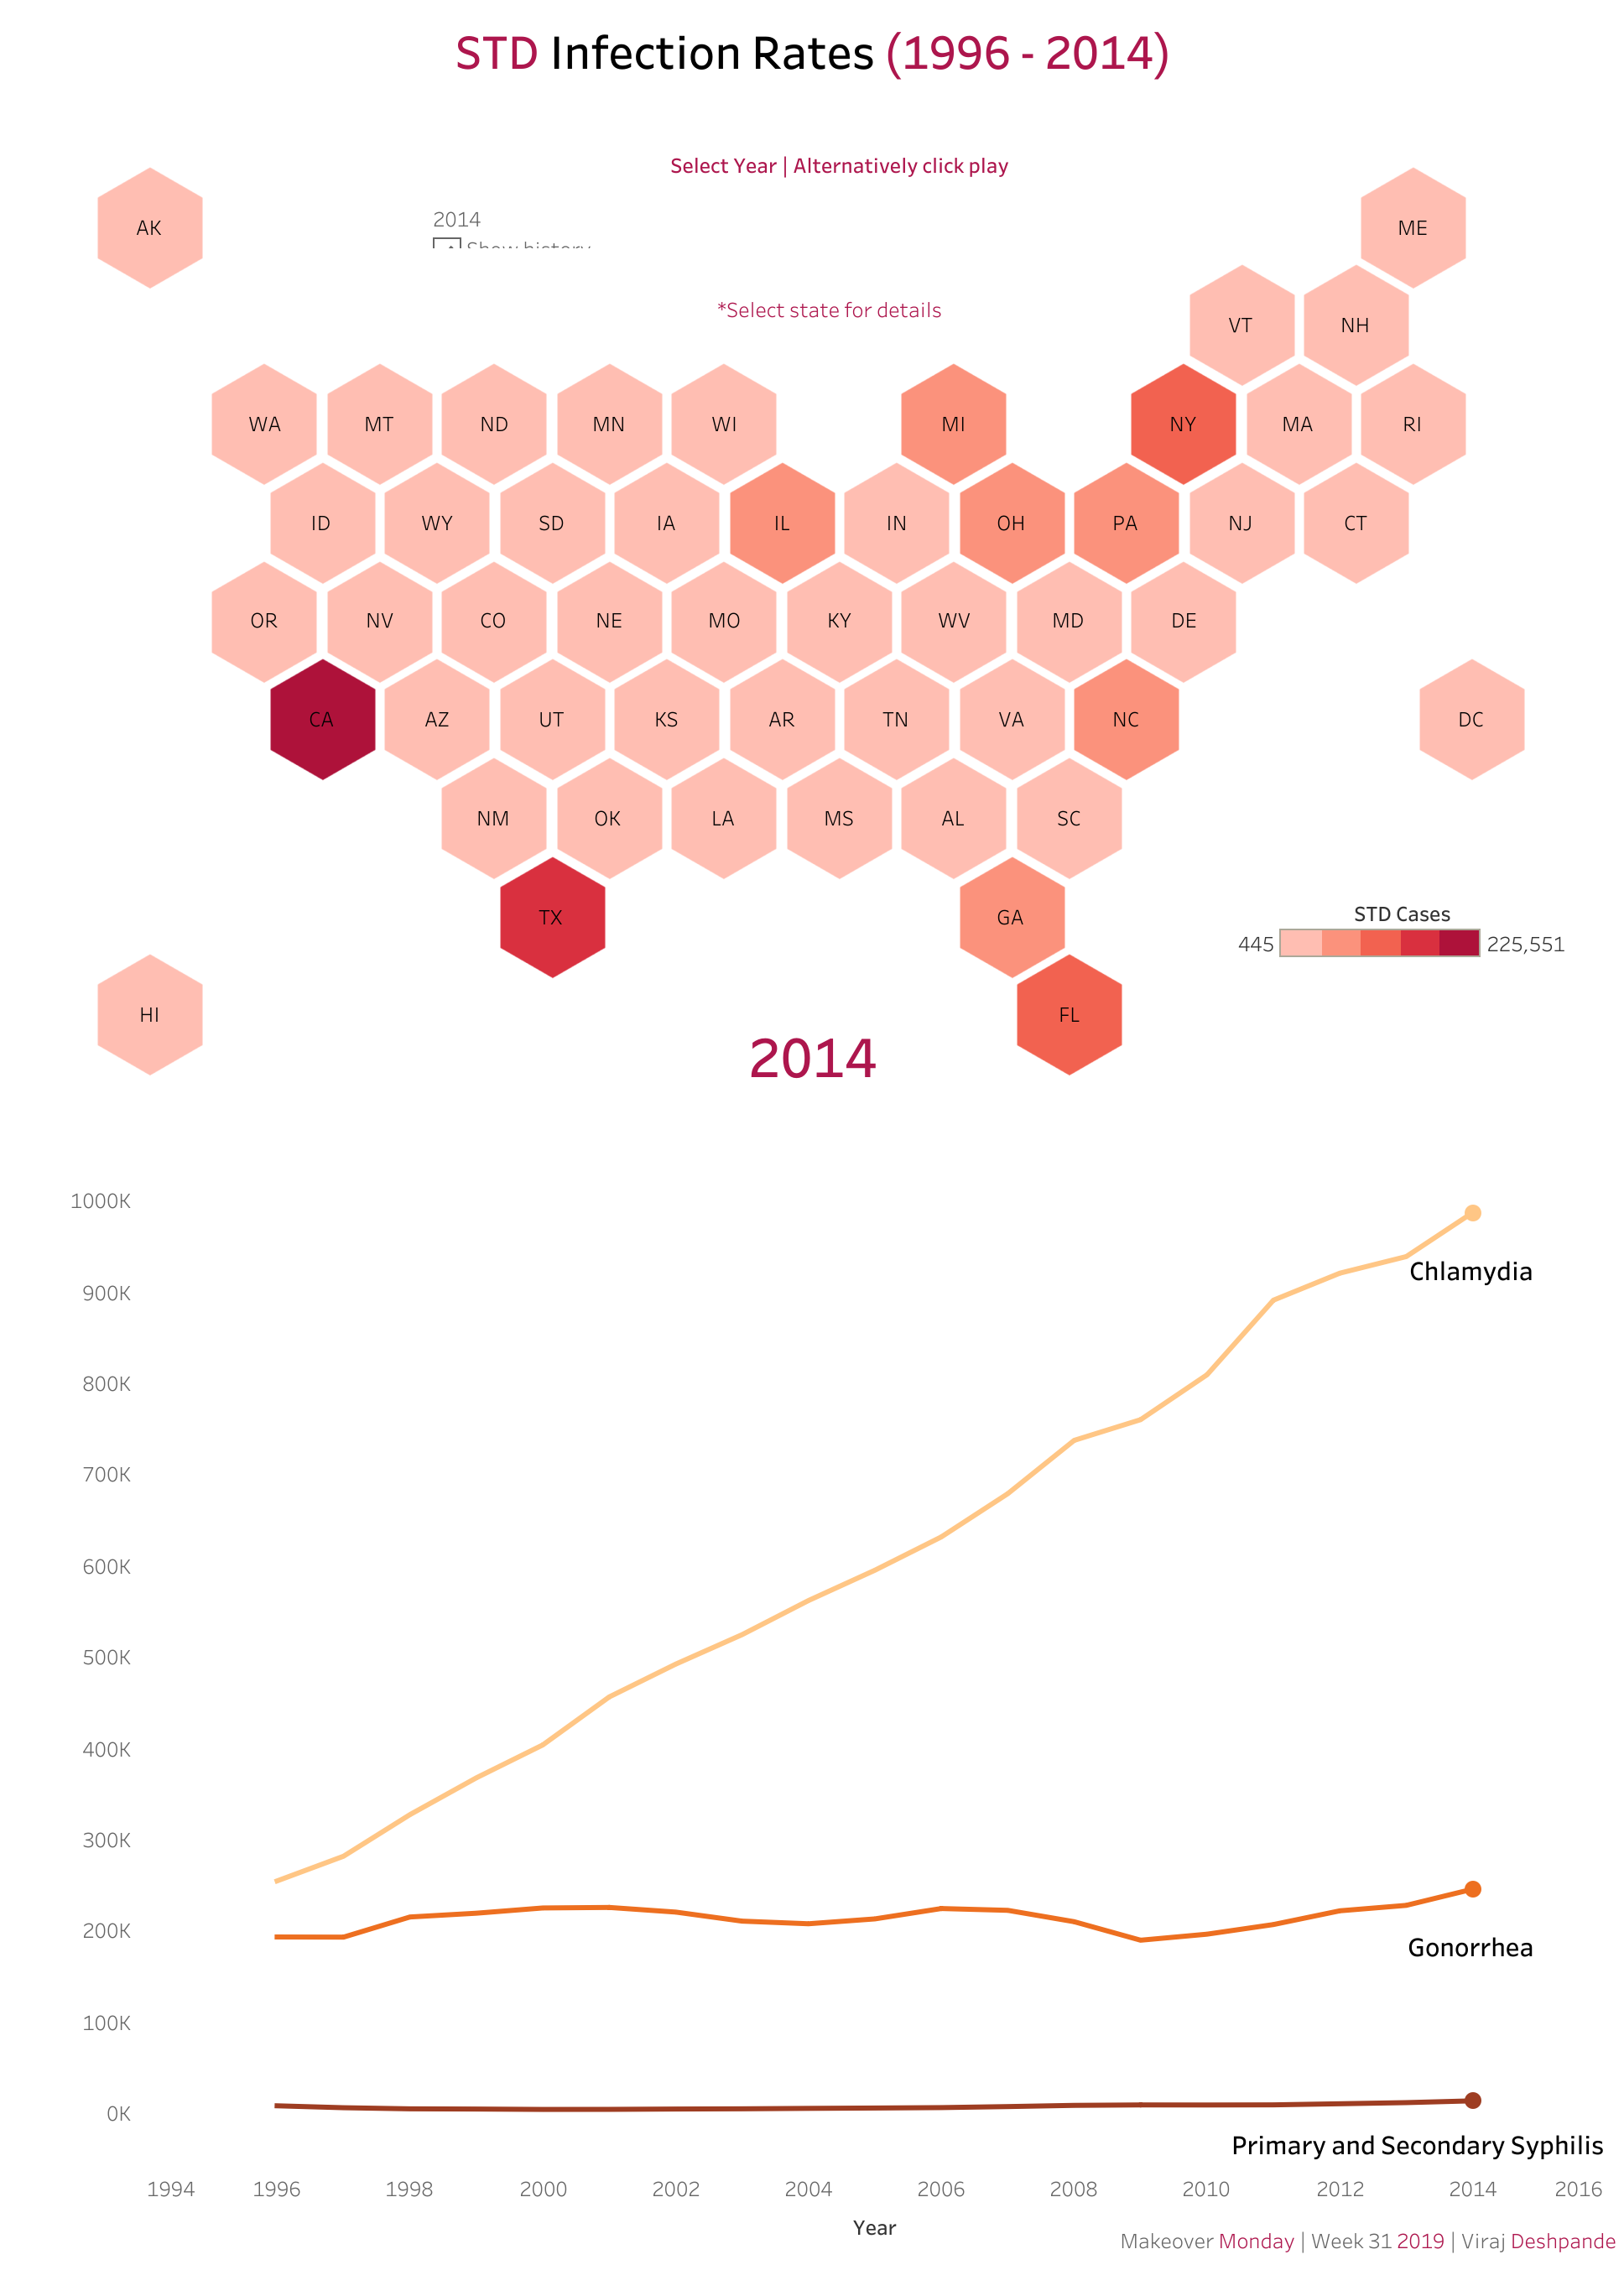
This visualization shows the progression of the no. of cases over the years. Since the dashboard is quite big – below are two gifs that show the dashboard in action:

I would love suggestion on best practices and on this visualization in general.

Follow me on twitter @viraj155

Navigating KPI Block

Workout Wednesday – Week 30

Week 30 saw a fairly simple workout that focussed on formatting and the capability of the designer to make the dashboard user friendly and responsive. The dashboard got me in a fix initially since the dashboard I created was extremely sluggish. Before we dive into the details lets take a look at the original dashboard.

Click here to view the interactive dashboard

If you view the original viz you’ll realize that the transitions are smooth and quick. That’s something that dashboard actions cannot achieve.

Being a beginner myself – it took me some time to decipher that the blocks are actually dashboard buttons with an overlay of a .png image of – city, order, customer, product count and not individual worksheets. This was a key takeaway – to speed up the transition/animation consider dashboard buttons instead of the dashboard actions.

Requirements

  • Dashboard size: 600 x 600, # of sheets is up to you
  • Create a 4 block of KPI/BANs representing the distinct count of
    • Customers
    • Cities + State combo
    • Product Name
    • Order IDs
  • Users should be able to click on a box and navigate to a bar chart that shows Sales by the chosen dimension
  • Match formatting (and I’ve turned off all tooltips this week!)
  • Colors come from Hue Circle

Here’s my viz –

Click here to view the interactive dashboard

Follow me on twitter @viraj155 to share and get updates on my weekly viz’s.